
How to Get Your Claim Denial Rate Below 5% (and Keep It There)
Industry-average claim denial rates run between 10–18% across most healthcare specialties. Best-in-class practices operate below 5%. That gap — often 10 percentage points of revenue — is one of the largest controllable opportunities in the revenue cycle. For a practice generating $5 million annually, reducing denials from 15% to 5% can recover more than $500,000 in earned revenue each year without increasing patient volume. The question is not whether denials can be reduced. The question is whether your workflows are designed to prevent them before the claim ever leaves the door. Here is the operational playbook.st description.
BLOG
Ashfaq Ahmad
5/20/20263 min read

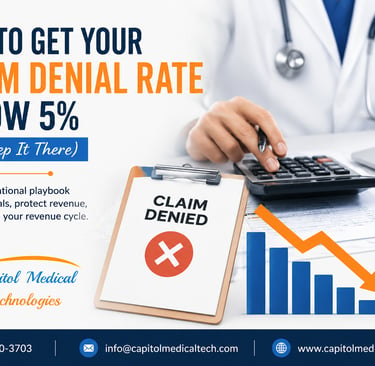
How to Get Your Claim Denial Rate Below 5% (and Keep It There)
Industry-average claim denial rates run between 10–18% across most healthcare specialties. Best-in-class practices operate below 5%.
That gap — often 10 percentage points of revenue — is one of the largest controllable opportunities in the revenue cycle.
For a practice generating $5 million annually, reducing denials from 15% to 5% can recover more than $500,000 in earned revenue each year without increasing patient volume.
The question is not whether denials can be reduced.
The question is whether your workflows are designed to prevent them before the claim ever leaves the door.
Here is the operational playbook.
1. Fix Eligibility Verification First
A significant percentage of denials originate before the patient is even seen.
Common causes include:
terminated coverage
incorrect payer selection
missing prior authorization
out-of-network status
unmet deductibles
inactive secondary insurance
Most of these issues are knowable in advance.
Eligibility and benefits should be verified before every encounter, not only for new patients.
Modern EHRs and clearinghouses already support automated eligibility checks. The key is pairing automation with human review of flagged exceptions.
This is usually one of the lowest-cost operational improvements with the highest immediate return.
Impact: Often eliminates 30–40% of preventable denials.
2. Tighten the Front-End Intake Process
The second major denial category is intake-related data errors:
misspelled patient names
incorrect DOBs
transposed insurance ID numbers
missing subscriber information
outdated insurance cards
These denials are almost entirely preventable.
Two workflow changes consistently improve accuracy:
Capture insurance cards digitally
Use photo capture and OCR tools instead of manual entry whenever possible.
Confirm critical fields verbally
At check-in, verify:
subscriber name
DOB
payer
member ID
group number
Small intake errors create downstream claim failures that are expensive to rework later.
Impact: Typically reduces denial volume by another 10–15%.
3. Get Coding Right the First Time
Coding errors remain one of the largest sources of avoidable denials.
Common issues include:
incorrect CPT coding
ICD-10 mismatches
missing modifiers
incorrect place of service
failed medical necessity linkage
bundling errors
This is where specialty expertise matters.
Generalist billing teams often miss payer-specific coding nuances, especially in high-complexity specialties.
High-performing organizations invest in:
specialty-trained coders
ongoing coding education
internal audits
payer-specific modifier training
pre-submission coding validation
Preventing a denial is dramatically less expensive than appealing one.
Impact: Often reduces denials another 15–20% in specialty-heavy practices.
4. Catch Documentation Gaps Before Submission
Many denials are not true “coding” problems.
They are documentation clarity problems.
Payers frequently deny claims because:
“Documentation does not support the level of service billed.”
In many cases, the information technically exists in the note — but it is not organized clearly enough for payer review.
Strong practices address this before claim submission through:
EHR documentation prompts
specialty-specific templates
pre-bill chart reviews
medical necessity checkpoints
coder-provider feedback loops
The goal is not simply documenting more.
The goal is ensuring the documentation clearly supports medical necessity, treatment rationale, and billed services on first review.
5. Build Payer-Specific Denial Playbooks
Every payer behaves differently.
Different plans apply:
different medical necessity criteria
different prior authorization rules
different modifier requirements
different documentation expectations
The organizations with the lowest denial rates treat payer knowledge as operational infrastructure.
That means maintaining:
top denial codes by payer
appeal language that works
payer-specific documentation requirements
authorization rules
escalation workflows
denial trend patterns
This work is tedious — but it creates a massive competitive advantage.
A practice operating at 5% denials usually has stronger payer intelligence than a practice operating at 15%.
6. Close the Loop With Monthly Denial Trending
If denials are not measured consistently, they cannot be improved systematically.
Every practice should review denials monthly by:
denial reason
payer
provider
location
service line
dollar impact
Then:
Identify the top denial categories
Trace the operational root cause
Push the correction upstream into workflow
This is where sustainable improvement happens.
Without trending, teams stay reactive.
With trending, teams become preventative.
That operational shift is what separates average revenue cycles from high-performing ones.
What a Path to Under 5% Actually Looks Like
In most engagements, denial improvement happens in phases.
Weeks 1–2
Baseline denial categories
Identify highest-dollar denial trends
Review intake and eligibility workflows
Weeks 3–6
Tighten front-end verification
Reduce registration errors
Improve authorization workflows
Weeks 6–12
Implement coding audits
Strengthen documentation review
Build payer-specific denial playbooks
Establish monthly denial trending
Most practices begin seeing measurable denial reduction within the first 30 days.
By approximately 90 days, many organizations can reduce denial rates into the 3–6% range — while also improving cash flow, reducing AR aging, and lowering rework volume.
The key is not simply “working denials harder.”
It is designing workflows that prevent avoidable denials from happening in the first place.
Final Thought
Most denial problems are not isolated billing problems.
They are workflow visibility problems.
The denial is simply where the operational failure finally becomes visible.
Practices that consistently maintain denial rates below 5% are usually not doing one magical thing differently.
They are:
catching errors earlier
standardizing workflows
improving payer alignment
reducing handoff loss
creating operational accountability upstream
That is what turns denial management from reactive cleanup into revenue protection.
Need a Denial Baseline for Your Practice?
At Capitol Medical Technologies, we help healthcare practices identify:
what is denying
why it is denying
what is recoverable
and where the operational breakdown actually begins
We offer a free denial audit and revenue cycle assessment for qualifying practices.
📞 571-410-3703
📧 info@capitolmedicaltech.com
🌐 www.capitolmedicaltech.com
Contact
Supporting Healthcare Practices with Reliable Revenue Cycle & Clinical Documentation Services
(571) 410-3703
© 2026. All rights reserved.
About Us |
Capitol Medical Technologies, LLC
45 Rockefeller Plaza
20th Fl # 391
New York, NY 10111
United States